
Imagine importing a large database using Oracle Data Pump. In the end, Data Pump tells you success/failure and the number of errors/warnings encountered. You decide to have a look at the log file. How big is it?
$ du -h import.log
 29M   import.log
29 MB! How many lines?
$ wc -l import.log
  189931 import.log
Almost 200.000 lines!
How on earth can you digest that information and determine whether you can safely ignore the errors/warnings recorded by Data Pump?
Data Pump Logfile Analyzer
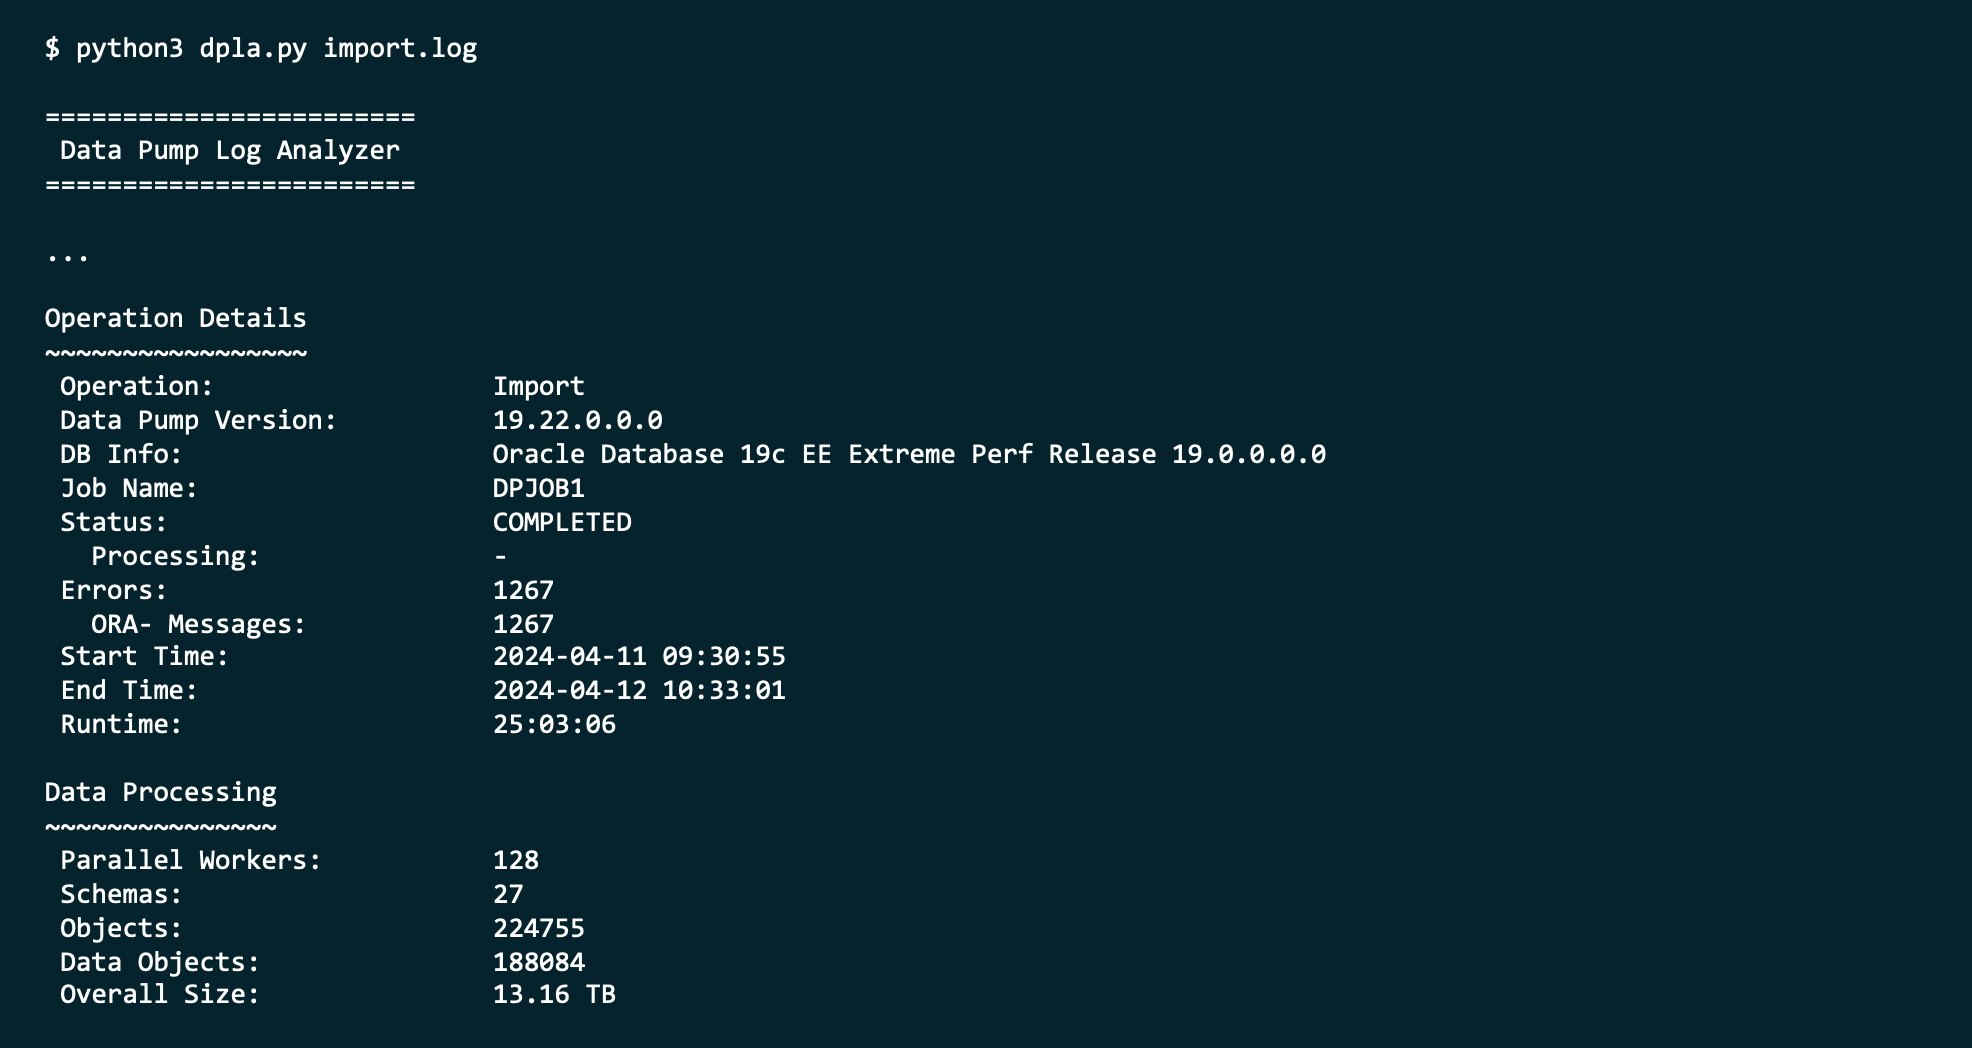
This is where Data Pump Logfile Analyzer (DPLA) can help you.
DPLA can summarize the log file into a simple report.
It can give you an overview of each type of error.

It can tell you where Data Pump spent the most time.

It can produce an interactive HTML report.

And so much more. It’s a valuable companion when you use Oracle Data Pump.
Tell Me More
DPLA is not an official Oracle tool.
It is a tool created by Marcus Doeringer. Marcus works for Oracle and is one of our migration superstars. He’s been involved in the biggest and most complicated migrations and knows the pain of digesting a 200.000-line log file.
He decided to create a tool to assist in the analysis of Data Pump log files. He made it available for free on his GitHub repo.
Give It a Try
Next time you have a Data Pump log file, try to use the tool. It’s easy, and instructions come with good examples.
If you like it, be sure to star his repo. ⭐
If you can make it better, I’m sure Marcus would appreciate a pull request.
Thanks, Marcus, good job! 💪

I installed it right away, works immediately (to my surprise – because of python3). Reports look great and well layed out. Thank you, Marcus and Daniel.
LikeLiked by 1 person
You’re welcome although all credit needs to go to Marcus – I’m just the messenger! :)
LikeLike
Just tried it for one of my log file. Started loving it already…
LikeLiked by 1 person
That’s good to hear! :)
LikeLike
Great tool, Thanks Marcus
LikeLike
Hi Daniel,
Great tool thx Marcus. I’m still getting my head around the reported seconds in the OBJECT DETAILS section when running the script with option -o for show object type details
Object Count Seconds Workers Duration
DATABASE_EXPORT/SCHEMA/TABLE/TABLE_DATA 363601 103527 40 103527
DATABASE_EXPORT/NORMAL_OPTIONS/TABLE_DATA 17 85122 40 85122
DATABASE_EXPORT/NORMAL_OPTIONS/VIEWS_AS_TABLES/TABLE_DATA 15 85108 40 85108
PACKAGE_BODY 83124 48845 40 1343
Duration of the DP import in report below
Start Time: 2024-10-03 12:36:20
End Time: 2024-10-04 01:19:43
Runtime: 12:43:23
How does the total duration in seconds map back to the actual time that the worker(s) took to complete the section in question. Or does this come back to some rounding error in the way Oracle reports the seconds in the actual log file? I understand that the values comes directly from the log file so I’m not blaming the script, was just wondering about this.
Otherwise very useful tool and thanks again.
LikeLike
Hi Neil,
I’m glad that you’re finding the tool useful, and I love that you’ve already dug into the details.
If you need details about this, I suggest that you reach out to Marcus; either via his homepage or LinkedIn. I’m sure he’d like to discuss the details with you.
Regards,
Daniel
LikeLike